Feature
MICE Market
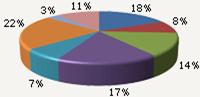
Organizers of the International Annual MICE workshop in Moscow have published their latest statistics. According to it, 91 companies from 47 countries took part in MICE Forum 2010 earlier in March. The following diagram below shows the breakdown by the type of a MICE event that the Russian MICE companies organize for their corporate clients:
Types of Events Organized:
Conference / Meeting |
18% |
|
International Conventions |
8% |
|
Incentive Travel |
14% |
|
Business Travel |
17% |
|
Exhibitions |
7% |
|
Corporate Hospitality |
22% |
|
Product Launch |
3% |
|
Sports |
11% |
While many companies experience a downturn in the overall spending on corporate travel in 2009, due to the critical economic situation, in 2010 the market is actively picking up. Many MICE organizers note an increase of smaller, more specialized events.
Concerning the size of the groups usually attending MICE events, 50-100 pax seems to be the average, with large groups from 250 to 500 or over 500 pax are uncommon:
Average attendance at events:
01-20 |
16% |
|
20-50 |
20% |
|
50-100 |
29% |
|
100-250 |
18% |
|
250-500 |
9% |
|
500+ |
8% |

The average budget for meetings and incentives in Russia is up to 100,000 euro, while more expensive events of a million euro and more are about 16%. This is a general increase of budgets compared to 2009, however the number of attendees of the events increased, especially in the 50-100 segment:
Annual Budget for Meetings & Incentives
Up to € 100,000 |
46% |
|
€ 100,000 to € 250,000 |
24% |
|
€ 250,000 to € 500,000 |
13% |
|
€ 500,000 to € 1,000,000 |
9% |
|
€ 1,000,000+ |
8% |

And finally, regarding the most popular MICE destinations, there is a growing preference for Western Europe but for more budget offers, with visa being a much lesser issue now than some 2 years ago. However, Turkey and Egypt, which have the best MICE infrastructure especially for large groups, still remain the leading destinations:
Geographical destinations for International MICE events:
Eastern Europe/CIS |
15% |
Western Europe |
16% |
Mediterranean |
12% |
United Kingdom |
9% |
Middle East |
7% |
Africa |
6% |
USA/Canada |
8% |
Central/South America |
6% |
Caribbean |
6% |
Asia |
10% |
Pacific |
5% |